
Before we jump into our final installment in this series, we thought it would be smart to take a moment and refresh your memory about what we’ve learned thus far.
In part 1, we injected noise into the CIFAR-10 dataset, trained models on that polluted data, and ran a pair of experiments. It shouldn’t come as a surprise that worse data produced worse model performance but what was far more interesting was that certain classes were much more impacted than others. Images of frogs and trucks were easy for our model to learn and the “lies” we told our model didn’t drastically impair its accuracy while noisy labels in cat data was significantly more detrimental.
Having learned that pollution affects classes rather differently in part 1, what we learned next in part 2 was that class sensitivity was not model specific. In other words, the same classes were consistently affected in consistent ways across different models, supporting the hypothesis that class sensitivity isn’t model-dependent but data-dependent. In essence: bad cat data affected each model more drastically than bad frog and truck data across the board.
In this installment, we’re going to build upon those lessons. We’re going to start by comparing the impact of data noise and data volume. Expressly, we’d like to understand which is more hostile to accuracy: polluted information or reduced quantity. We compared our custom-built CNN model with popular and off-the-shelf deep learning architectures such as ResNet18, UnResNet18 (ResNet18 without skip connections), GoogLeNet, and LeNet.
Here’s what we discovered with our own model:

And here’s how it compares to some popular models in the industry today:
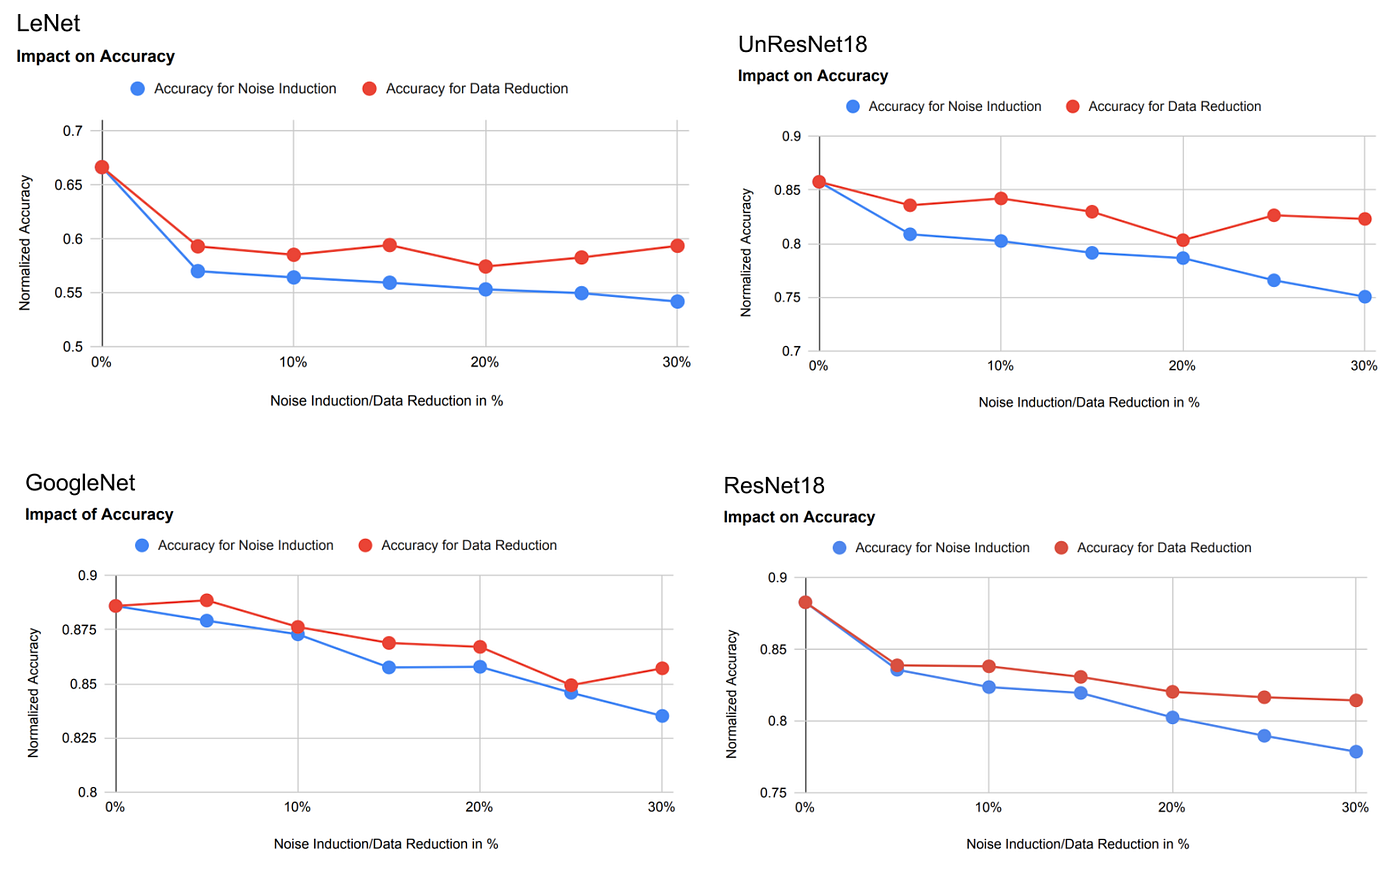
As you can see, regardless of the model we used, bad data was more detrimental than less data. To put it another way: labeling noise impacts model performance more than volume reduction. And that makes sense. After all, reducing data volume reduces the amount of good data while polluting data also reduces the amount of good data but replaces it with harmful labels.

Figure 2: Relation between data volume and labeling noise
Now that we have seen the impact of labeling noise and data volume reduction on the overall accuracy of the model, let us see how the accuracy of each class in CIFAR-10 gets impacted those factors.
To measure this, we’re using a measure we named the Impact Index. First we noted the True Positive Rate (TPR) score for each class across multiple levels in our experiment. The levels here are the same percentages reflected in figure 1, namely the percentage of noise or data reduction at 5 percent intervals. The TPRn_norm and TPRd_norm reflect the change from the baseline with zero percent pollution (i.e. scores above 1 are improvements in true positive rate, scores below are poorer performance).
Looking at our airplane class, those figures look like this:

Table 1: Change in TPR for the airplane class using our custom model
Impact Index Y-X is simply the measure of the distance between the baseline and the noise induction score (Y) minus the distance between the baseline and the data reduction score (X). If you’re more of a visual person, think of it like this:

Figure 3: An illustration of how Impact Index Y-X is calculated
Put simply, Impact Index Y-X is a shorthand for how much more pollution harmed a model than data reduction did.
So what can we do with this measurement? Well, in our previous pieces, we’ve proven that polluted data hurt model accuracy more than less data but also that certain classes are more affected than others. We’ve also learned that those classes are affected regardless of the model used. With this measurement we can actually quantify how much each model is affected and each stage of our experiment. Here’s how each model fared at every 5% interval:

Figure 4: A visualization of Impact Index Y-X over each class in each model
(Interestingly, in our custom model, reduction was seemingly beneficial to the truck, ship, deer, and frog classes, even at 30% reduction. Noise, on the other hand, was never beneficial at 30%.)
You can see that the cat, bird, deer, and dog classes were affected most, regardless of the model used. That said, the last thing that stuck out to us is that bird was one of the most affected classes. It’s also abundantly clear that the LeNet model was the weakest performing for this class, regardless of the amount of pollution we injected. It’s performance with just 5% noise is worse than at 30% in any other model:

Figure 5: Impact Index Factor for Class Bird
And while that underscores what we found in parts 1 and 2 of this series–that the relative sensitivity of data classes is largely model-agnostic–it’s also worth underscoring that even though data quality is the main driver of model accuracy, the model you choose matters too.
Some models, like LeNet, are very sensitive to noise while others models can cope with it a little better. And of course, no matter what, your data quality is the truest driver of accuracy.
CONCLUSION
So what did we learn about lying to your models? For starters, we learned that different classes are affected differently and different methods of “lying” affect those classes differently as well. We learned that bad labels are much more detrimental than less data. And it follows that models trained on bad data are harder to fix than ones that just need more of it. Which is all to say: no matter how much time you spend deciding which models to use for your project, make sure you dedicate serious energy to making sure you’re giving it the right data.
And if that means it’s less data than you really wanted, that’s fine. Avoiding noise sets you up for more success later. After all, it’s usually a lot easier to get more quality data later than to work with the pollution you didn’t catch earlier.


0 Comments